
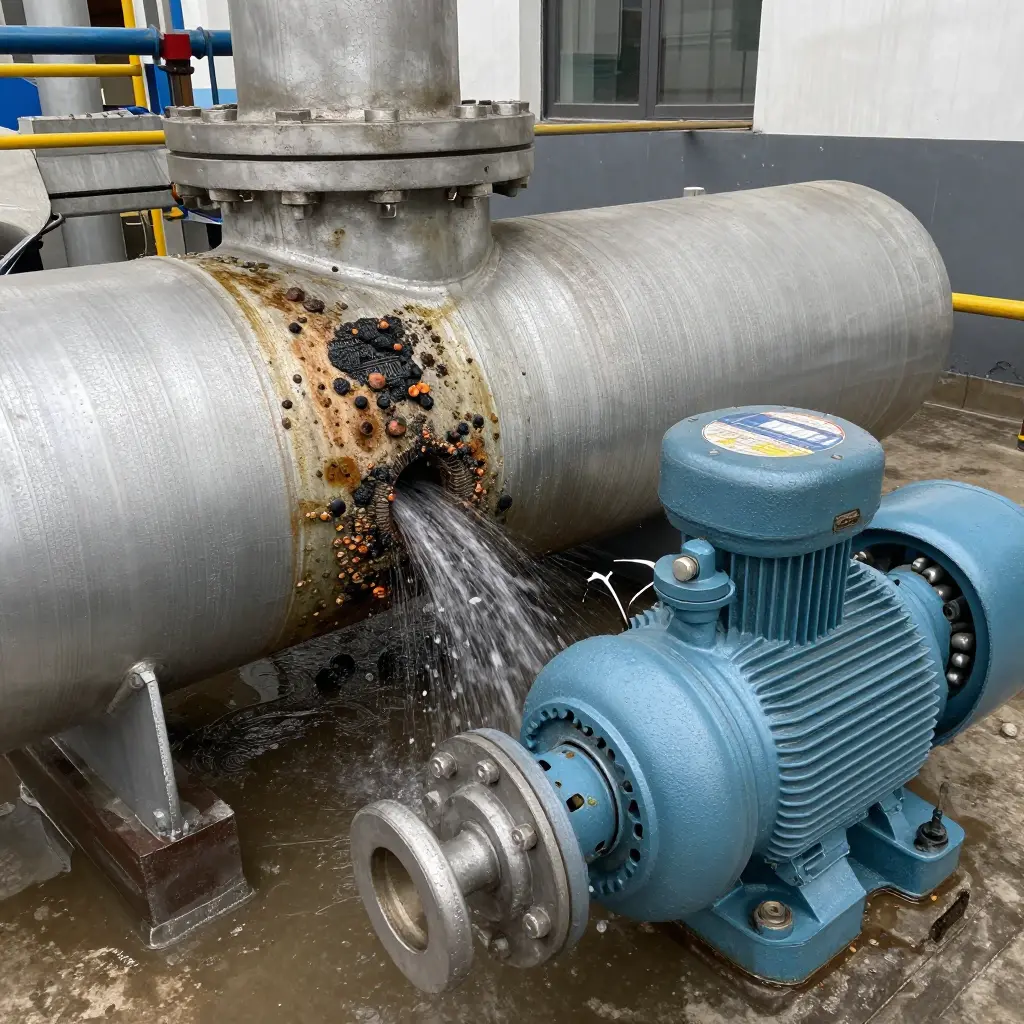
Why Heat Exchanger Fouling Shows Up as Pump Cavitation
Heat exchanger fouling is the buildup of deposits — scale, sludge, corrosion products, or biological film — on the internal surfaces of a heat exchanger. Those deposits insulate the metal, so the fluid leaves hotter than the design intended. For maintenance engineers and automotive technicians, fouling is one of the most common causes of cooling system trouble and one of the easiest to overlook.
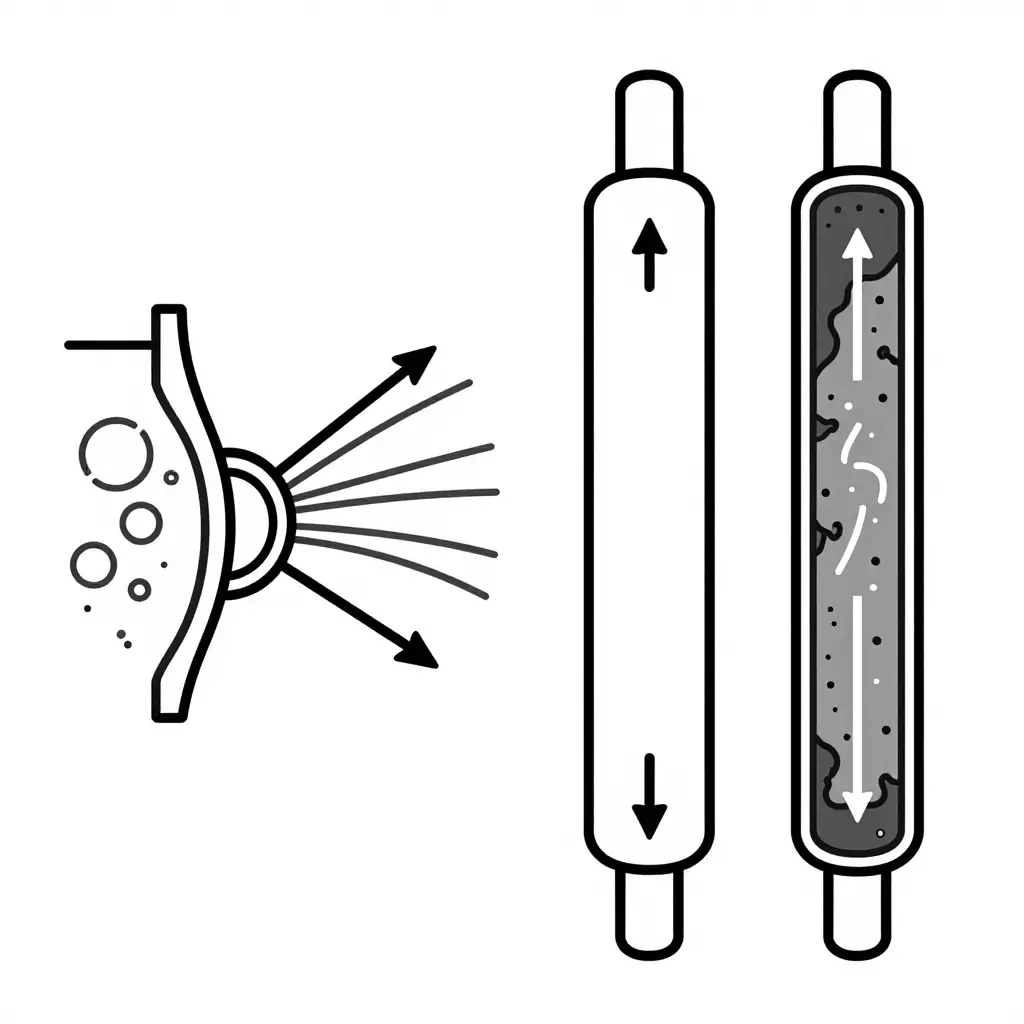
Pump cavitation is the formation and violent collapse of vapor bubbles inside a pump. When local pressure falls below the fluid’s vapor pressure, bubbles form; when pressure recovers, they implode, eroding metal and producing the familiar rattle or gravel-like noise. Left alone, cavitation destroys impellers, seals, and housings.
Temperature is what connects the two. Fouling raises fluid temperature and narrows the available net positive suction head (NPSH) margin, because warmer liquid has a higher vapor pressure and flashes at a lower suction pressure. As the deposits thicken, the pump loses the cushion it needs to stay ahead of that vapor pressure, and cavitation begins. The steps below are the field checks that confirm the link.
How the two problems connect
Fouling inside an exchanger rarely stays a heat-transfer problem. Left alone it becomes a pump reliability problem, and cavitation is how the damage arrives. The sequence is predictable.
Step 1: Deposits build on heat exchanger surfaces
Scale, sludge, and process debris plate onto tube walls and plates. Each layer insulates the metal, so the fluid no longer touches a clean surface.
Step 2: Flow restriction and reduced heat transfer raise loop temperature
The deposits narrow the flow path, which cuts circulation, and they block heat transfer, so the fluid keeps heat it should have shed. The loop ends up running hotter than its design point.
Step 3: Higher temperature raises liquid vapor pressure
Temperature and vapor pressure move together: warm the liquid and its vapor pressure climbs, so it turns to gas at a lower absolute pressure than before. A fluid that once stayed safely liquid at the suction eye now sits much closer to boiling.
Step 4: NPSHA falls below NPSHR
A pump’s net positive suction head available (NPSHA) depends on suction pressure, static head, and liquid vapor pressure. Rising vapor pressure pulls NPSHA down, while the net positive suction head required (NPSHR) stays where it was, because fouling does not change the pump itself. The NPSH margin between the two shrinks toward zero.
Step 5: Vapor pockets form and cavitation begins
Once the margin is gone, pressure at the impeller eye drops below the liquid’s vapor pressure. Bubbles form and collapse against the impeller as pressure recovers. That collapse is cavitation.
What you’ll actually see
The usual signs are a rattling or gravel-like noise, vibration, falling head and flow, and pitting or erosion on the impeller. When they turn up in the maintenance bay, check heat transfer performance before replacing the pump; a fouled exchanger is often the real source.
Catch the deposits early and the chain never starts. Ignore them and you will keep replacing pumps that were never the problem.
Field troubleshooting checklist
Run this list as soon as discharge pressure starts fluctuating, vibration rises, flow drops without explanation, or a pump keeps tripping after the obvious causes have been ruled out.
- Check the suction strainer: pull the basket, inspect for debris, and clean or replace it before restarting the pump.
- Log pump discharge temperature: a slow, steady climb often signals recirculation caused by restricted flow.
- Measure differential pressure across the heat exchanger, recording inlet and outlet readings on the same gauge set.
- Compare that differential pressure against the clean baseline or design value. A rising trend points to fouling.
- Check suction pressure and confirm the net positive suction head margin; falling suction pressure starves the impeller.
- Measure actual flow rate. Output that drops while pump speed stays constant suggests an internal restriction.
- Record heat exchanger inlet and outlet temperatures; narrowing approach temperatures confirm reduced heat transfer.
- Listen for and measure vibration at the pump bearings. Cavitation produces a distinct crackling and erratic amplitude.
- Inspect the impeller for pitting and erosion. Visible damage indicates sustained cavitation, not a one-off event.
- Document every reading with timestamps, then trend the data across several shifts to confirm fouling before scheduling a cleaning.
Work in order and keep the notes together. The pattern across the whole list usually says more than any single reading.
Use the table to match what you see in the loop with the fouling condition most likely behind it, so you can confirm the diagnosis before taking anything apart.
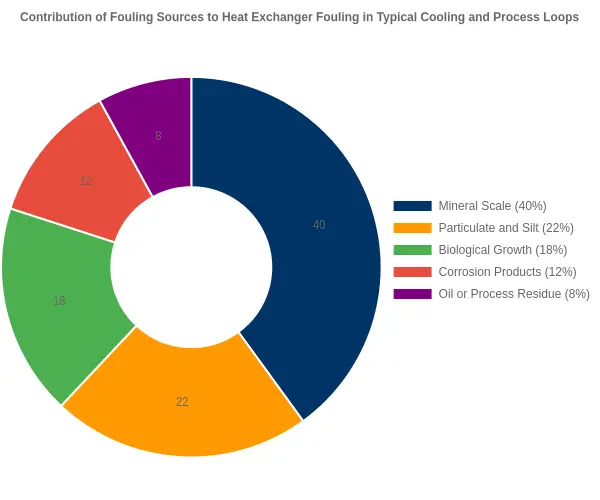
| Fouling type | Primary indicator | Effect on suction head | Typical pump symptom |
|---|---|---|---|
| Scale or mineral deposit | Hard, chalky white or tan crust on tube walls and hot surfaces | Steady rise as passages narrow and flow drops | Gradual NPSH loss, rattling cavitation, falling discharge pressure |
| Biological growth | Slimy film, algae, or dark biofilm; musty odor in the fluid | Progressive drop as flow area fouls unevenly | Intermittent cavitation at low load, erratic flow and noise |
| Particulate or silt | Gritty sediment in the strainer or low points; cloudy fluid | Sudden drop when solids block inlet or strainer | Sharp suction starvation, rasping pump noise, rapid head loss |
| Corrosion product | Rust-colored flakes or iron oxide sludge downstream | Moderate, fluctuating drop as debris migrates | Sporadic cavitation bursts, vibration, seal wear |
| Oil or fuel residue | Oily sheen, greasy film, or black tar on surfaces | Slight drop from reduced heat transfer and vapor pockets | Foamy flow, unstable suction, cavitation-like cracking under heat |
Reading the Instruments: What Your Gauges Are Telling You
Before you condemn a pump, check the instruments. Fouling reshapes the operating envelope slowly, and the readings show it long before a bearing fails. Log the values over time, because a single snapshot rarely tells you much.
Compare each reading against its baseline:
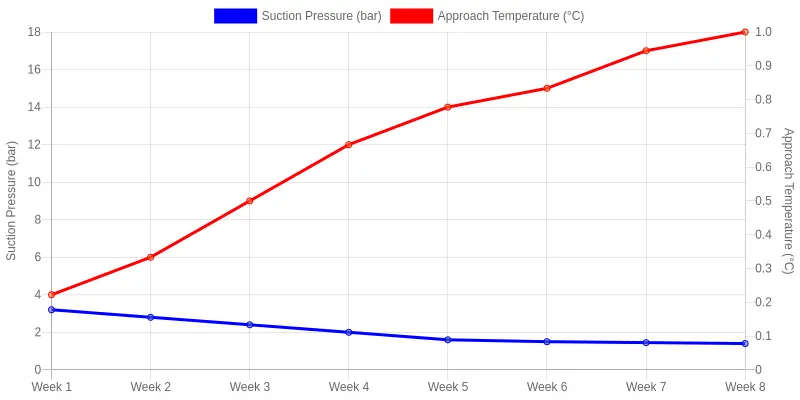
- Suction pressure gauge trend: Suction pressure that falls while flow demand holds steady signals rising resistance upstream. As fouling narrows the exchanger passages, fluid struggles to reach the pump and the gauge creeps down week after week.
- Differential temperature across the heat exchanger: A widening approach temperature — the gap between the process outlet and the cooling medium — means the unit is rejecting less heat. The lost duty shows up as hotter fluid downstream and higher return temperatures.
- Vibration and noise: Cavitation produces a distinctive crackling, a gravel-in-the-pump sound, and erratic high-frequency vibration. Amplitude often climbs even as flow drops.
- Flow meter deviations: When the meter reads below what the pump curve predicts at that shaft speed, the restriction is hydraulic rather than mechanical.
The confirming pattern is rising approach temperature and falling suction pressure over the same window. Together they mean the exchanger is fouled, the suction line is starved, and the cavitation is a symptom of the fouling, not its cause. The chart plots both trends across eight weeks.
Clear the fouling and clean the suction path, then re-check: suction pressure and vibration should recover together. If they do not, keep looking upstream.
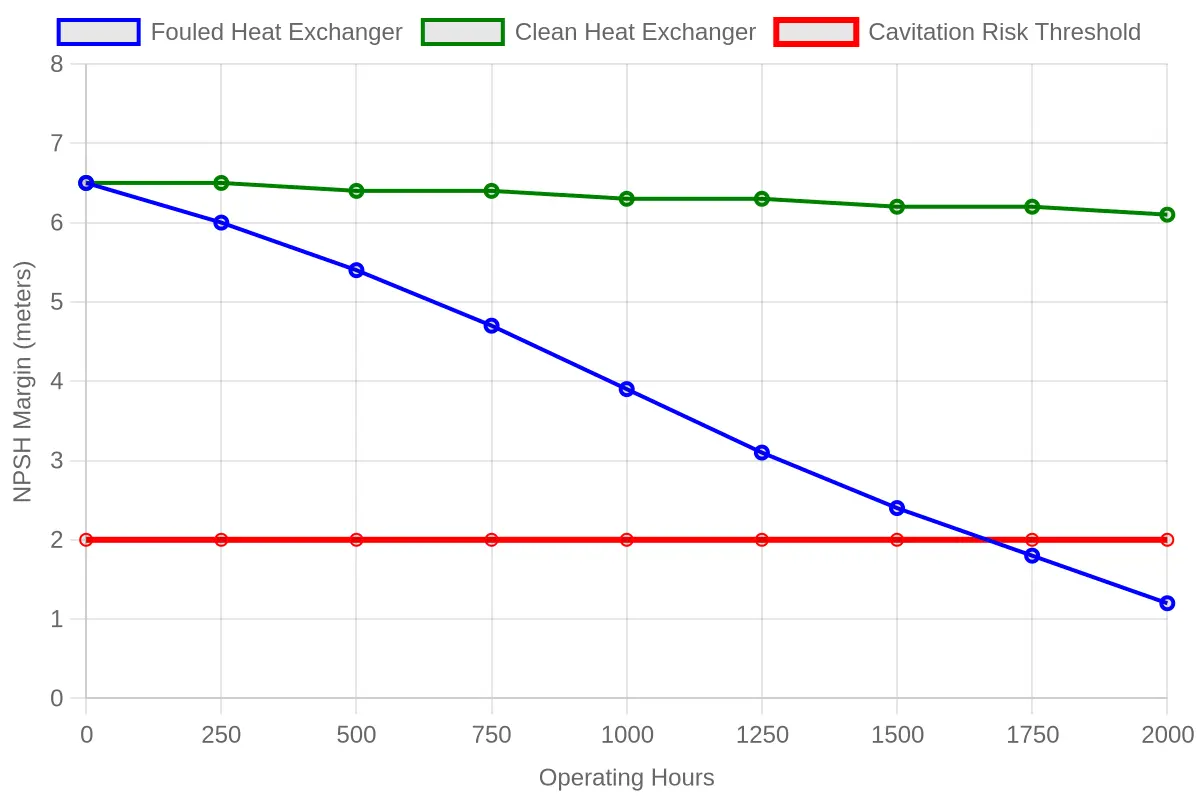
Figure: NPSH margin trend over 2,000 operating hours.
| Operating Hours | Fouled Heat Exchanger (m) | Clean Heat Exchanger (m) | Cavitation Risk Threshold (m) |
|---|---|---|---|
| 0 | 6.5 | 6.5 | 2.0 |
| 250 | 6.0 | 6.5 | 2.0 |
| 500 | 5.4 | 6.4 | 2.0 |
| 750 | 4.7 | 6.4 | 2.0 |
| 1000 | 3.9 | 6.3 | 2.0 |
| 1250 | 3.1 | 6.3 | 2.0 |
| 1500 | 2.4 | 6.2 | 2.0 |
| 1750 | 1.8 | 6.2 | 2.0 |
| 2000 | 1.2 | 6.1 | 2.0 |
The chart plots NPSH margin in meters against operating hours from 0 to 2000. The fouled exchanger series falls steadily from 6.5 m to 1.2 m and crosses the 2.0 m cavitation risk threshold between 1,500 and 1,750 hours. The clean exchanger series stays nearly flat, from 6.5 m to 6.1 m, well above the threshold throughout.
Distinguishing Fouling-Driven Cavitation from Other Causes
Fouling narrows the flow path, so it presents as a slowly growing suction restriction: crackling at the pump, dropping discharge pressure, vibration that creeps in over weeks. Five other common problems produce nearly the same symptoms. Working through the checks in order keeps you from rebuilding a healthy pump while the real restriction sits inside a fouled exchanger.
Low Liquid Level
When suction level drops, cavitation arrives suddenly and tracks the level gauge. Top up the tank and the noise disappears almost instantly. Fouling does not heal on its own; it worsens gradually no matter how full the tank is.
Partially Closed Suction Valve
A valve left throttled, often after maintenance, throws a sharp pressure drop across the valve body. Feel the temperature gap between its inlet and outlet, verify the handle position, and reopen it fully. Fouling spreads its restriction across the exchanger rather than concentrating it at one point.
Wrong Impeller Trim
If the pump never performed as designed from day one, suspect an incorrect impeller trim rather than fouling. A shortfall that appears immediately after install and stays constant points to the trim, while fouling degrades performance progressively from a known-good baseline.
Entrained Air
Air entrainment brings hissing, erratic flow, and bubbles at the sight glass or seal, and it pulses with changes in tank agitation or a vortex at the surface. Fouling produces a steady, continuous rattle with no free-air signature. Vent the system and watch whether the symptoms vanish.
High Fluid Temperature from External Sources
External heat raises fluid temperature upstream, which lifts vapor pressure and cuts available NPSH. Check the suction temperature reading: if it climbs independently of pump load, the fault is thermal, not deposits. Fouling leaves suction temperature essentially unchanged.
| Cause | Primary Diagnostic Signal | Differs from Fouling Because |
|---|---|---|
| Low liquid level | Sudden onset tied to level gauge; clears when refilled | Fouling worsens progressively and never self-heals |
| Partially closed suction valve | Localized pressure drop across valve; sharp onset | Fouling spreads restriction across the exchanger |
| Wrong impeller trim | Shortfall present from day one, constant | Fouling degrades a known-good baseline over time |
| Entrained air | Hissing, bubbles, pulsing flow, vortex | Fouling is steady with no free-air signature |
| High fluid temperature | Suction temp rises independent of load | Fouling leaves suction temperature unchanged |
Read differential-pressure trends alongside suction temperature before you pull the exchanger. Getting the diagnosis right the first time saves both downtime and unnecessary parts.
Corrective Maintenance
Once fouling is confirmed as the root cause, work the problem in the right order. Clean the wrong component first and you push debris downstream into a freshly repaired pump.
Step 1 – Isolate the exchanger
Isolate the heat exchanger on both the process and utility sides. Lock out the pump, drain the shell and tube sides, and record the differential pressure and flow readings before you touch anything. Those baseline numbers are your only honest benchmark for the work ahead.
Step 2 – Clean chemically, then mechanically
Start with a chemical clean to soften and dissolve the deposit. Circulate a compatible descaling or dispersant solution at the recommended concentration and temperature, then soak. Only after the chemistry has done its job should you follow up mechanically — rodding tubes, brushing, or hydro-blasting — to remove what remains. Reversing that order drives hard scale deeper into the tube bundle.
Step 3 – Flush the loop
Flush the entire circulating loop until the flush water runs clear and the chemistry is neutralized. Skipping this step leaves loosened debris to settle inside strainers, low points, and the pump suction, which is a reliable way to bring the cavitation back.
Step 4 – Replace fouled filters
Replace every fouled strainer basket and cartridge filter before restart. A partially blocked suction filter lowers the available NPSH at the pump inlet, so a clean filter is part of the repair, not an afterthought.
Step 5 – Re-verify NPSH margin
With the exchanger clean and the filters fresh, recalculate the net positive suction head available against the pump’s required NPSH. Confirm you now hold a comfortable margin — typically around 1 meter above NPSHR at the duty flow.
Step 6 – Confirm pump performance
Restart the pump and compare head, flow, and vibration against the baseline you recorded in Step 1. If the readings are still drifting, the fouling source has not been fully addressed, so revisit your cleaning method before returning the unit to normal service.
Prevention and monitoring
Catching fouling early costs far less than a rebuilt pump, a seal replacement, or an impeller repair after cavitation has chewed up the internals. Build a routine that flags the drift before the damage starts, instead of reacting to noise, vibration, and falling discharge pressure.
Scheduled cleaning intervals
Work from service history rather than a fixed calendar. Set a baseline cleaning interval from the fluid type, solids loading, and duty cycle, then shorten it if fouling returns early. Closed-loop systems running clean, treated water may hold for 12 months, while open loops with hard water or process debris often need attention every 8 to 12 weeks.
Water treatment and filtration
Most fouling starts with what is in the water. Scale, biological growth, and suspended solids all deposit on hot tube surfaces and throttle flow. Use side-stream filtration, softeners, or chemical dosing to keep conductivity, pH, and hardness in range, and clean strainers and filters on the same schedule as the exchanger.
Trending differential pressure and temperature data
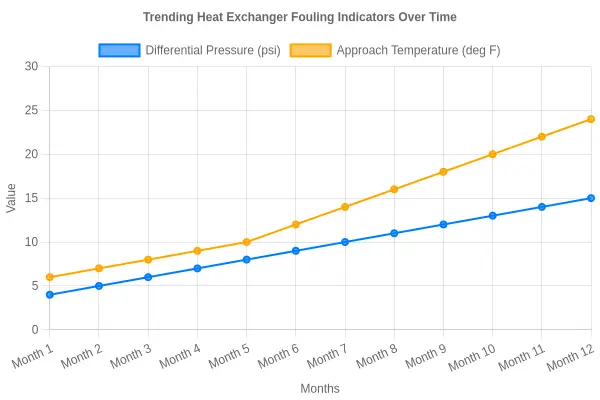
This is where the diagnosis lives. Log the inlet-to-outlet differential pressure and the approach temperature every shift or day. A steadily rising pressure drop paired with a climbing approach temperature is the fingerprint of fouling.
Setting maintenance triggers before the NPSH margin reaches risk threshold
Plot a trigger line before the fouled exchanger starves the pump. By the time the NPSH margin starts shrinking toward the manufacturer’s minimum, flow restriction upstream is already eating into the net positive suction head. Set your trigger at roughly 80% of the way to that limit so cleaning happens while there is still headroom. A simple rule: clean at the pressure or temperature point that historically preceded your last cavitation event.
Monitoring points to log every shift or day:
- Heat exchanger differential pressure (inlet vs. outlet)
- Approach temperature (process vs. cooling side)
- Pump suction pressure and available NPSH margin
- Flow rate against the original design value
- Vibration and noise signature at the pump
- Water chemistry: pH, conductivity, and hardness
Trend these points side by side. When differential pressure and temperature climb together while suction pressure sags, fouling is pushing the pump toward cavitation, and your trigger should already have you scheduling a cleaning. For shops that also run vehicle wrap and custom livery work, treating maintenance data with the same discipline keeps every asset, from pumps to printed graphics, performing the way it was specified.
FAQ: Heat Exchanger Fouling and Pump Cavitation
Can a fouled heat exchanger really cause pump cavitation?
Yes. Fouling on the tube walls restricts flow and raises the pressure drop across the unit. If the pump draws from a circuit with a starved suction or hot, vapor-laden fluid, that added resistance can pull the net positive suction head available (NPSHa) below the required value (NPSHr) and trigger cavitation.
What is the first measurement to check?
Check suction pressure (or NPSHa) at the pump inlet against the pump’s NPSHr curve. Falling suction pressure together with a rising differential temperature across the exchanger strongly points to fouling as the root cause, and confirming both numbers before disassembly saves hours of guesswork.
How does temperature affect NPSH margin?
Higher fluid temperature raises vapor pressure, which directly shrinks the NPSH margin. When fouling reduces heat transfer, process temperatures can creep upward, so the liquid flashes more easily at the impeller eye. Even a modest temperature rise can erase a thin margin, so correct NPSHa for the actual operating temperature.
How often should heat exchangers be cleaned to prevent cavitation?
There is no universal interval; it depends on water quality, duty, and fouling rate. Many plants trend the approach temperature and clean when it drifts by roughly 3-5 degrees Fahrenheit. Condition-based cleaning, driven by pressure-drop and performance data, keeps fouling from stealing your NPSH margin.
Can cavitation damage occur without visible fouling?
Yes. Internal scale, corrosion products, or biofilm can be invisible from the outside while still choking flow. A heat exchanger can look perfectly clean externally yet have heavily fouled tubes, so mechanical inspection and performance trending matter far more than a quick visual glance.
Does cleaning the exchanger always stop the cavitation?
Not always. If the pump was already running with a marginal NPSH, cleaning may restore performance only temporarily while other causes, such as entrained air, a clogged strainer, or a worn impeller, keep driving cavitation. Treat cleaning as one step in a full troubleshooting sequence, not a guaranteed fix.
Closing Thoughts: Connecting the Symptom to Its Source
Fouling rarely announces itself as the root problem. It sits upstream, raising suction losses until the pump begins to cavitate, and the rattle, the reduced flow, and the premature impeller wear are symptoms rather than the source. The cause is usually inside tubes that throttle flow, drop pressure, and starve the pump of the net positive suction head it needs to stay stable.
Following the same sequence every time — confirm cavitation, measure the NPSH margin, inspect the upstream piping and strainers, then trace back to the heat exchanger — connects the symptom to its source instead of chasing it in circles. Watching the margin turns that work into an early warning, flagging declining suction conditions long before damage appears.
The most dependable way to prevent cavitation is to plan maintenance around fouling before it reaches the pump. Scheduling cleaning and inspection from monitored trends keeps suction conditions steady and equipment running. Maintenance planning, done well, is less about fixing failures than about stopping them upstream, where they begin.